Isoscope
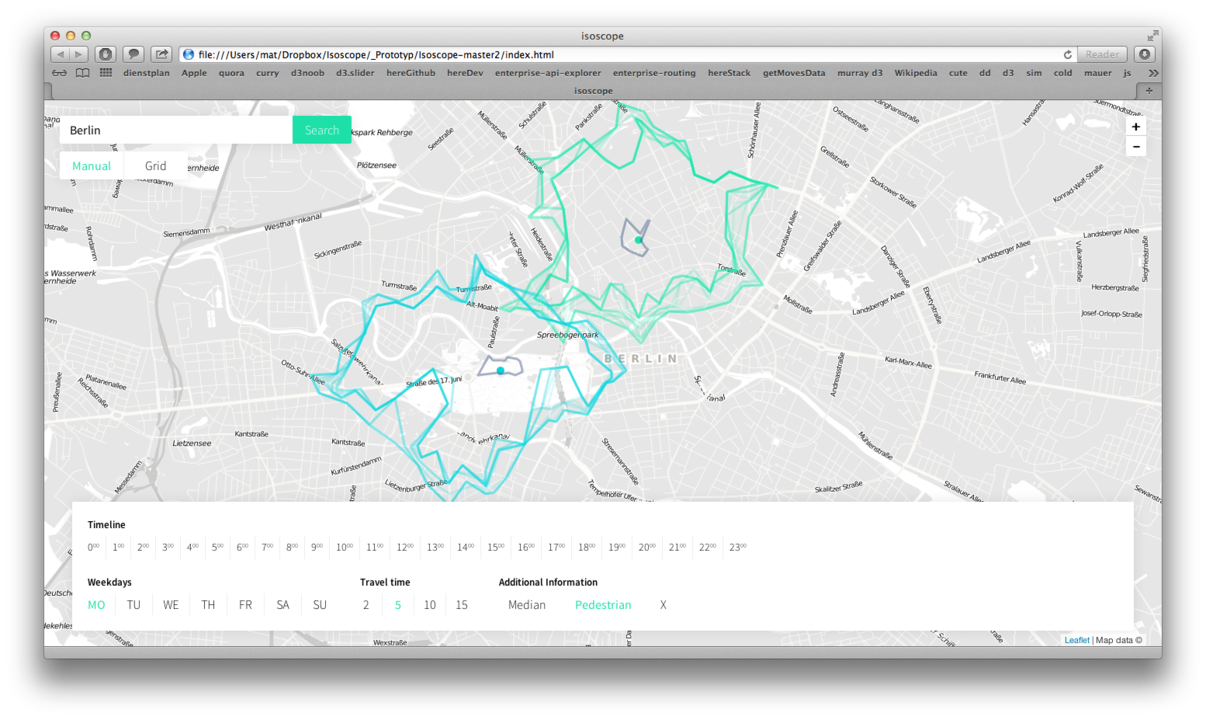
Exploring MobilityAs we think about traffic in cities as somewhat like the pulse of the city, Isoscope is an approach to capture this rhythm with its up and downs. It's an interactive tool that creates aesthetic visuals about locations that are reachable by car in a chosen time from a chosen location. The boundaries of the reachability is shown by 24 layered organic shapes, while one layer represents one hour of the day. The output reveals many information like the traffic infrastructure, connectivity of regions and natural boundaries. Since the location to choose is not exclusive, places all over the world can be explored and compared.
Try Isoscope yourself! Go to Isoscope
Isoscope - Visualizing temporal mobility variance with isochrone maps from VGTCommunity on Vimeo.
The idea
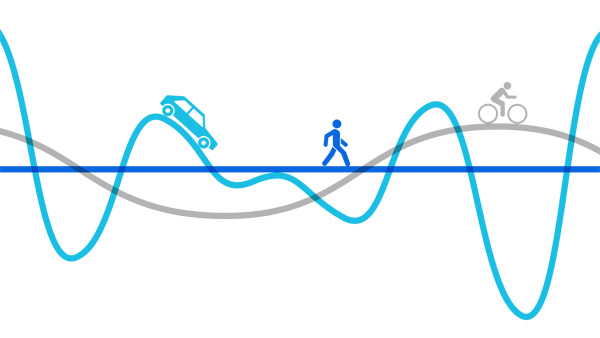
We drive to the closest supermarket, take the bike to the gym or walk to the cafe next door for a nice chat among friends. Getting around — thus mobility — is an essential part of our being. We were especially intrigued by those situations when our mobility is compromised such as in traffic jams or during tough driving conditions. How do those restrictions impact our journeys through the city and who is affected most? Obviously, a car can hardly bypass a traffic jam, whereas a bike is more flexible to continue its journey. Let alone the pedestrian who can stroll wherever he wants to. Isoscope tries to answer the questions above by comparing different means of transport and their sensitivity for disturbances.
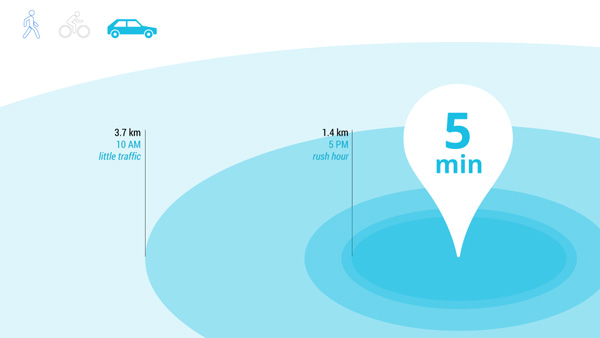
Once you are stuck in bad traffic conditions, you will need more time to cover the planned distance. In other words: stuck in a traffic jam, you will cover a smaller distance in a predefined amount of time. This is, what Isoscope is about: layered shapes show the area around a chosen location that is reachable within a chosen travel time. As traffic conditions change throughout the day, there are 24 layered shapes - each representing one hour of the day.
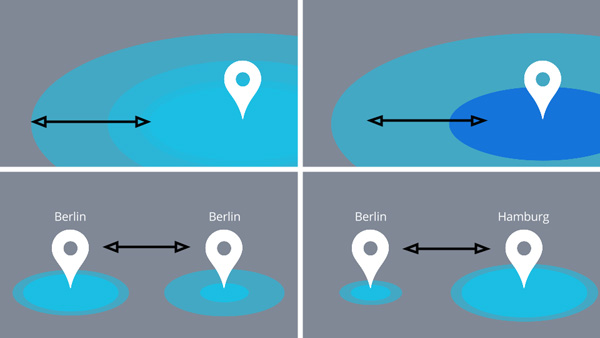
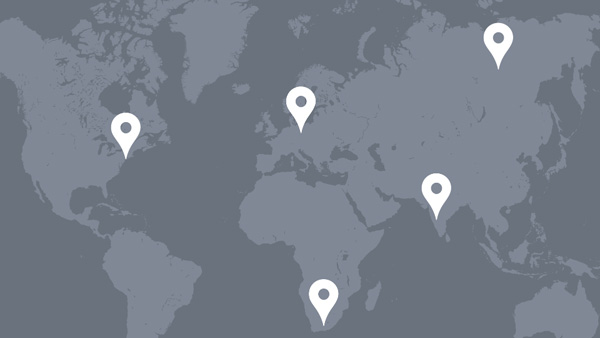
With Isoscope one can easily see and compare the influence of traffic conditions on our mobility or compare the reach of different means of transport. Within or among cities. Worldwide.
Related works
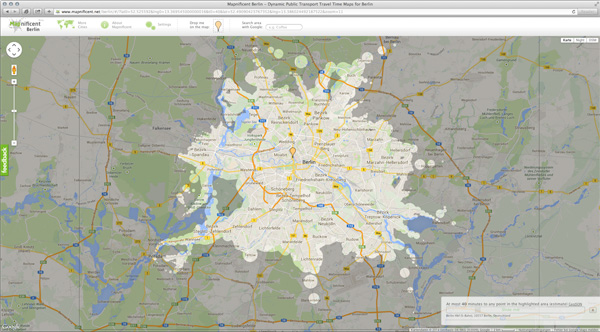
The following two projects deal with a similar matter as Isoscope. The first, Mapnificent by Stefan Wehrmeyer, shows areas one can reach by public transport in a given time. This sounds very familiar to our project. While Mapnificent uses idealistic time-table data to compute the reachable area, Isoscope takes real-time and historic traffic data into account. In addition, Isoscope is applicable worldwide whereas Mapnificent is available for major cities only.
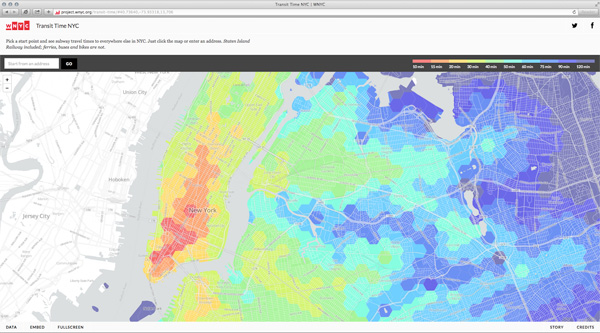
One second project, Public Transit Travel Time by Andrew Hardin, uses a heatmap to show transit travel times in 8 major US cities. As it is true for Mapnificent, Andrew Hardin's work uses planned public transit data and its scope is limited to selected US cities only. While the current project shows ten different areas reachable within 10 to 120 minutes, Isoscope focuses on one specific travel time revealing deviations in the reachable area due to changes in traffic conditions.
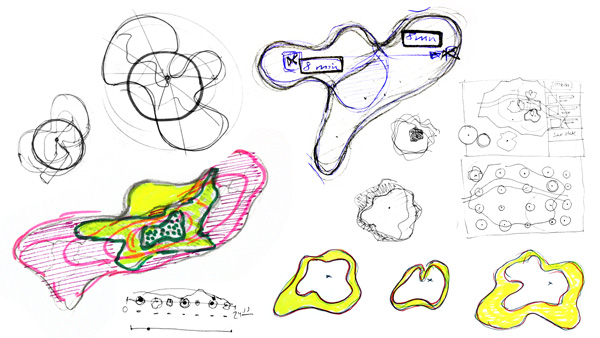
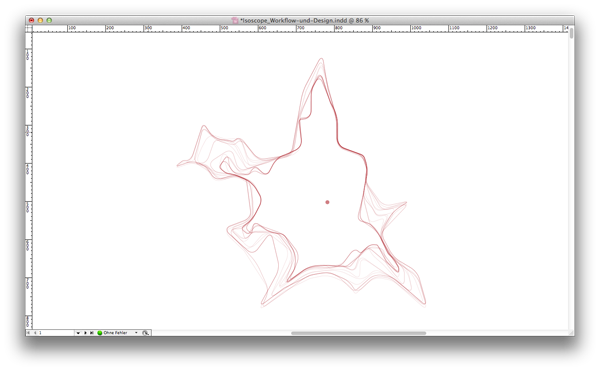
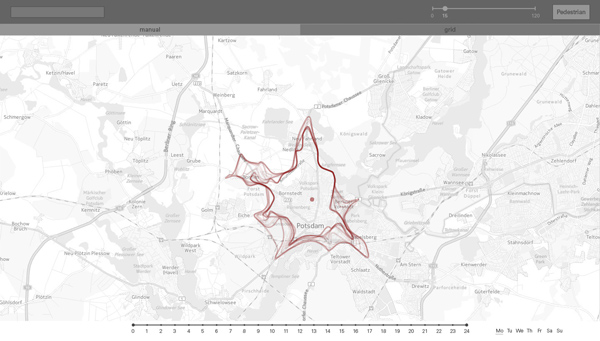
The process
From initial sketches and scribbles to a running interactive prototype.
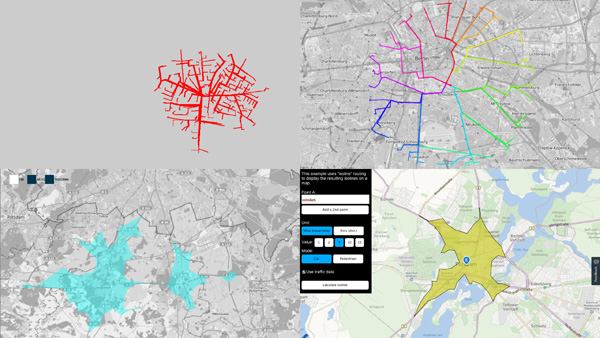
As we advanced in the ideation of Isoscope and agreed on some kind of organic shapes representing our "mobility scope", we made our first programming steps in Processing using the HERE API. Initially, we tried to calculate all possible routes from a given location within a specific time. Only afterwards we came across the HERE Isoline API that calculates areas reachable within a given time automatically. Since we wanted Isoscope to be platform-independent, we changed the programming environment from Processing to JavaScript. Several iterations regarding the look of the shapes, map style and UI elements and functionality finally led to Isoscope V 1.0.

Our result
Video showing the basic functions while exploring Berlin, Barcelona, Paris, London, Boston and New York. Go ahead and check your home town, favorite spot or any other place on the globe: Explore Isoscope!
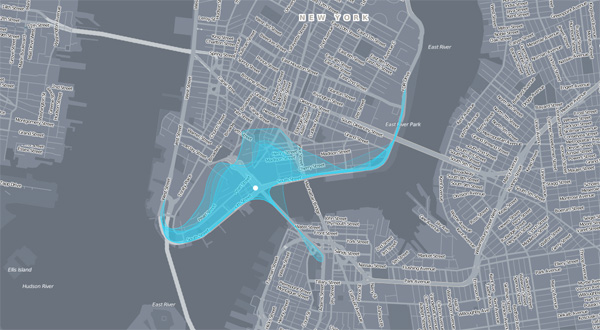
New York – Brooklyn Bridge | 4min
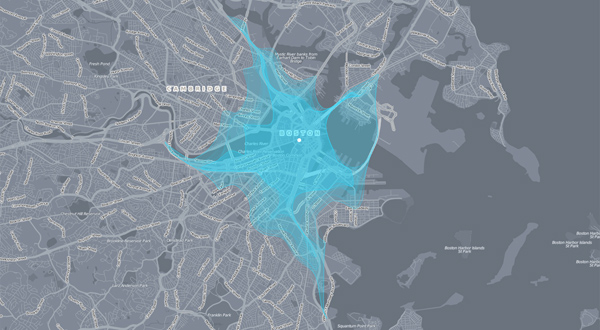
Boston – Boston Common | 10min
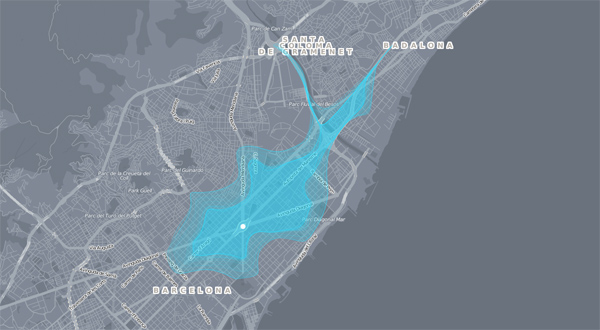
Barcelona – Plaça de les Glòries Catalanes | 6min
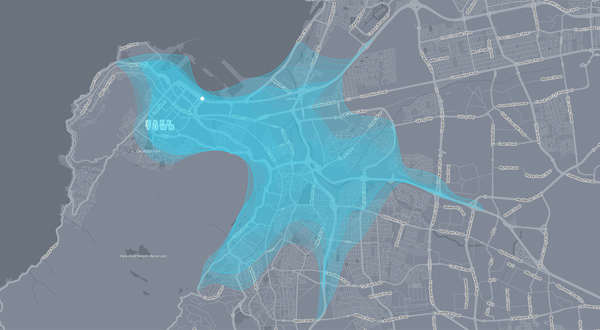
Cape Town – Foreshore | 10min
We are very happy to offer our application online. Even though we haven't still finished all of our intentions, there is already a whole world to explore with Isoscope. So happy exploring!
A project by:
Flavio Gortana, Sebastian Kaim and Martin von Lupin
supervised by Till Nagel during the class "Urbane Ebenen: Mobilität" at the University of Applied Sciences Potsdam
© 2014 - Flavio Gortana, Sebastian Kaim, Martin von Lupin